")
")
Visit the following websites to have more information on market reasearch, forecast, export development, etc.
SME Toolkit for Market Development: http://www.smetoolkit.org
Trade Map: http://www.trademap.org
CBI (Centre for the Promotion of Imports from developing countries): https://www.cbi.eu
The latest preliminary statistics of the General Administration of Customs showed that total exports and imports of Vietnamese goods during the first period of July/2016 (from 01/7 to 15/07/2016) was over 14.51 billion decreased 4% (corresponding to the reduction of 605 million) compared to the second period of June/2016.
Thus, by the end of 15/07/2016 the total exports and imports of goods turnover of the whole country reached more than 177 billion dollars, an increase of 2.8% (corresponding to more than 4.85 billion US dollars) over the same period in 2015. The balance of trading in the first period of 7/2016 decrease 87 million USD, putting the trading balance of the whole country since the beginning of 7/2016 to 15/7/2016 was a surplus of nearly 1.61 billion USD.
In the first 15 days of 7/2016 enterprises with foreign investment (FDI) reached an export turnover of more than 9.22 billion USD, down 2.7%, which equal to a decrease of 259 million USD compared to the second half of 6/2016. At the end of 15/07/2016 this block export turnover reached nearly 113.64 billion dollars, up to 4.3%, corresponding to more than 4.64 billion dollars over the same period in 2015. The trade balance goods of the business sector with FDI in the first half of 7/2016 reached 630 million USD, bringing the surplus of this sector from the beginning of the year to the end of 15/07/2016 more than 10.87 billion USD.
On the Export:
Export turnover of Vietnam in the first period of 7/2016 reached more than 7.21 billion USD, down 6.2% (corresponding to a decrease more than 477 million USD), compared with 15 days last month 6/2016. By the end of the day 15/07/2016 exports of the country reached more than 89.3 billion USD, up to 6.5% (corresponding to nearly 5.44 billion dollars) over the same period in 2015.
Compared with the second half of 6/2016, exports in the first period 7/2016 vary strongly in some commodity groups as: cement and clanke 36.5% increase respectively 6 million USD; fruits and vegetables increased by 28.7%, corresponding to an increase of 26 million USD; rubber up 18.3%, corresponding to an increase of 12 million USD; On the other side, coal fell 98.9% respectively down 3 million USD; iron and steel decreased by 48.3%, equivalent to 59 million USD; precious stones, non-ferrous metals and products decrease 36.9%, down 35 million USD; chemicals fell 31%, down 16 million USD; ...
Table 1: The export turnover of the 10 largest commodity groups of Vietnam from the first period of 7/2016 to 15/07/2016

The value goods exports of enterprises with foreign direct investment (FDI) in this period reached nearly 4.93 billion USD, down 7.1% (corresponding to the decrease of 375 million USD) compared to 15 days of late 6/2016. Thus, by the end of the day 15/07/2016 exports turnover of FDI enterprises reached more than 62.25 billion USD, up 9.8%, respectively an increase of nearly 5.56 billion USD over the same period of 2015 and accounted for to 69.7% of total exports turnover of the whole country.
On the import:
The value goods imports of Vietnam in the first period of 7/2016 reached more than 7.3 billion USD, down 1.7% (equivalent to a decrease of 127 million), compared to 15 days of late 6/2016. By the end of the day 15/07/2016 goods imports turnover of the whole country reached nearly 87.7 billion dollars, down 0.7% (corresponding to a decrease of 584 million USD) over the same period in 2015.
Compared with the second half of the 6/2016, imports during the first period of 7/2016 vary strongly in some commodity groups as: raw tobacco materials 1.7%, respectively an increase of 5 million USD; cameras, camcorders and accessories increased by 45%, equivalent to 16 million USD; animal food and raw materials raised by 41.9%, respectively to an increase 53 million; motorcycles and components and spare parts went up by 29.9%, corresponding to an increase of 5 million USD; ... In contrast, a decrease of 73% soybean products corresponding reduction of 74 million USD; Other vehicles and parts decreased 61.6%, down 36 million USD; liquefied natural gas fell 59.7%, down 14 million USD; ores and other minerals fell 45.3%, down 16 million USD; ....
Table 2: Import turnover of the 10 largest commodity groups of Vietnamin the first period from 6/2016 accumulated to 15.06.2016


An imported goods of enterprises with FDI in the first period of 7/2016 worth nearly 4.3 billion USD, up 2.8% (respectively up 115 million USD) compared to 15 days of last 6/2016. Thus, by the end of the day 15/07/2016 imports turnover with FDI enterprises reached nearly 51.39 billion USD, down 1.8% over the same period in 2015, down 916 million USD, accounting for 58.6% of the total gooods imports of the whole country.
Source: Vietnam Customs
The Vietnam Customs Statistics announced that in the first half (01-15/3/2015) of March-2016, Vietnam’s total exports of US dollars 7.06 billion and imports of US dollars 6.80 billion resulted in a trade surplus of US dollars 264 million. Accordingly, the total value of export and import turnover of Vietnam in the first half of March was US dollars 13.86 billion, increased by 4.6% (equal to USD 606 million) as compared to the second half of February-2016.
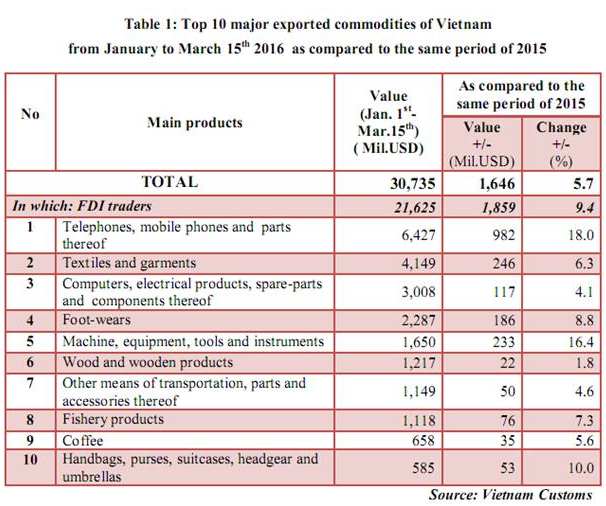
Vietnam‘s trade-in-goods from January to the first half of March of 2016 totaled US dollars 60.54 billion in value terms. It posted an increase of 0.8% (equivalent to USD 464 million) from the same period of previous year. In which, the total merchandise export value was up 5.7% to US dollars 30.74 billion and the total merchandise imports value was down 3.8%, to US dollars 29.80 billion.
In the view of Foreign Direct Invested (FDI) traders, the value of exportation and importation in the first half of March reached USD 5.04 billion and USD 4.14 billion respectively. In comparison to the performance of corresponding period of 2015, from January to March 15th of 2016, the total export value of FDI traders went up 9.4% to US dollar 21.63 billion. In the meanwhile, import value was posted at USD 17.94 billion, down by 4.3%.
Export:
When compared with the second half of February-2016, export of first half of March went up by 7.0%, mostly as a result of the upturns registered in following products: textiles and garments (up by USD 206 million); wood and wooden products (up by USD 74 million); precious stones, precious metal and articles thereof (up by USD 35 million)..
Import:
In the first half of March 2016, import increased by 2.2% in comparison to second half of February, mainly reflecting the upwards of animal fodders and animal fodder materials (up by USD 57 million); computer electrical products spare parts and component thereof (up by USD 52 million); iron and steel (up by USD 36 million); other base metals (up by USD 24 million);...

Source: Vietnam Customs


